An Overview of Coincidental Peak Costs by ISO
Coincidental Peak (CP) is the measurement of an electricity meter’s actual usage at the time of the regional grid’s highest demand and determining that meter's share of the entire grid’s demand. This concept of identifying a facility’s share of the grid’s total maximum demand is often used in determining the allocation of specific cost components. The specific methodology of how that equation works and which cost components it impacts varies from region to region, and often even utility to utility, and even by customer class, but the overall concept is the same. In this post, we explain how this works in each of the major, deregulated electricity regions, and detail which costs are the most impacted by this variable.
New York (NYISO): 1CP
New York’s concept of a coincidental peak is relatively simple, with just a few caveats. First, the concept in New York is often referred to as your ICAP (Installed Capacity) tag, or sometimes as just 1CP, for the one peak hour. The math for New York is rather simple, the ICAP tag is calculated as each meter’s total kWh used during the one hour of the grid’s maximum demand. The requirements applied to the determination of which hour is the final maximum hour are the following:
-
The hour must take place in July or August
-
The hour must be on a non-holiday weekday (not July 4th and not a weekend)
Once the maximum hour is determined, a meter’s ICAP is determined by finding that meter’s actual usage in that same hour and grossing it up by two factors, one to account for transmission and distribution line losses of the system and the other for forecasted modeling error. This grossed-up maximum hour value is a meter’s ICAP quantity to be used in all capacity cost calculations starting the next capacity year, which begins in May and ends in April. This means that the ICAP value from this summer’s maximum demand day will start to affect energy costs on the system starting in May 2023. If you have not yet included both volumetric and price risk into your third-party supply agreement covering next summer, then this summer’s actions will directly impact your costs starting next May.
New England (ISO-NE): 1CP
New England’s 1CP concept is very similar to New York’s in that it utilizes the single maximum demand hour and a meter’s coincidental usage, but without the limitations of July or August and weekdays only. But even without those limitations, the peak hour typically falls in July or August, with only three of the past 21 years having the peak fall in June instead of July or August. This 1CP value is used in determining next year’s capacity obligation quantity for the June through May capacity year.
Texas (ERCOT): 4CP
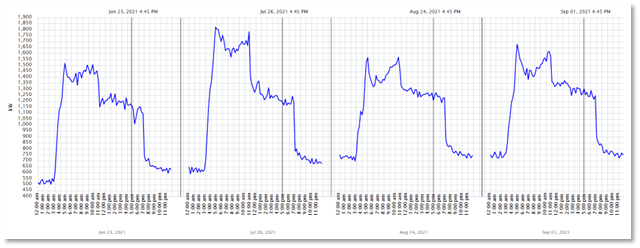
The Texas CP program is referred to as 4CP for the 4 months included in the calculation. The concept is similar to the New York process above in identifying an ESIID’s 15-minute usage during the grid’s maximum 15-minute demand interval. However, instead of doing the process for the one maximum hour during July and August, the calculation is done four distinct times, once for each of the four summer months from June through September. The four maximum hours and an ESIID’s four coincidental usage values in kW for those four 15-minute periods are then averaged together to determine one average kW value. This 4CP kW is then used during the next calendar year for all transmission-level charges billed from a Transmission and Distribution Service Provider (TDSP). Figure 1 shows the four month’s peak demand interval day and times, and this specific meter’s exact usage during those four 15-minute intervals from last summer. The quantity, in this example (1,314 kW), was used for the Transmission Cost Recover Factor charges starting in January 2022, which are currently about $6.21 per 4CP per month in Oncor. This equates to about $73.44 per 4CP kW per year or $73,440 per MW per year.

Figure 1: Peak Demand Interval Day and Times for June to September from 5
PJM (IL, OH, PA, NJ, MD, DE, DC): 5CP
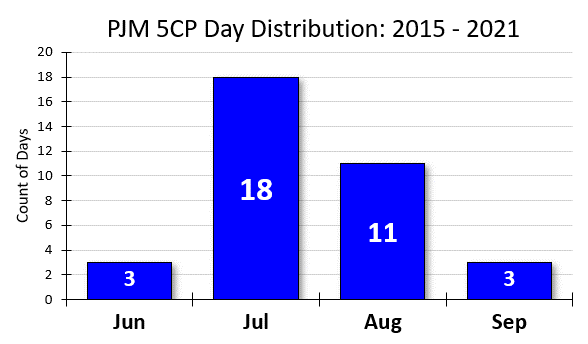
Lastly, PJM applies a similar concept to determine each electricity account’s capacity obligation but takes the five highest hours from the five highest peak days across the entire ISO, and averages those hourly consumption values together to get what is referred to there as the Peak Load Contribution (PLC). PJM is also a summer peaking region, meaning historical peaks have all taken place during the summer months. As shown in Figure 2, most peak days occur in July, with August a close second. Historically, few peak demand days occur in the months of June and September.
This system-wide 5CP value is the main driver of capacity cost obligations for the next capacity year, which in PJM is from June through May, therefore the amount of electricity used this summer on CP days will ultimately affect electricity costs starting in June of 2023. Right now, the auction to clear capacity for next summer is scheduled for this June and prices are not certain, but in general, capacity prices across PJM range from $20 to $70 per kW per year.
A secondary coincidental peak methodology is also prevalent across PJM utilities to allocate transmission (NITS) costs to coincidental peak demand. However, this peak is at the individual utility level instead of the PJM region, and each utility has its own discretion to use a 1CP or 5CP methodology. This makes it difficult to manage both the PJM capacity (5CP) and the utility-specific 1 or 5CP.

Figure 2: PJM 5CP Day Distribution: 2015-2021 from 5
Contact us if you would like to learn more about how your business can take a bite out of rising energy prices by receiving 4CP, 5CP, or 1CP alerts and taking steps to reduce demand charges this summer.


