To say that commodity markets have been volatile during the last 12 months is an understatement, especially for natural gas. This volatility had many drivers including one of the most active hurricane seasons in over a decade, big drops in LNG demand over the summer followed by a rebound in the fall, one of the warmest Novembers on record, and the frigid temperatures at the beginning of the new year. These factors all contributed to significant price swings in spot natural gas prices.
The highly volatile spot price of natural gas has been offset by a more docile futures market, where prices have remained relatively stable. Prices for the current prompt month gas contract (May 2021) are trading at $2.75/MMBtu, right in the middle of its 12-month trading range as shown in Figure 1. Overall, natural gas futures have been “well-behaved” and range-bound, a radical departure from their trading behavior a decade ago. This tranquility and lack of volatility in the forward markets has distinguished natural gas from other commodities that are traded on the CME (the merged companies of the Chicago Mercantile Exchange and the New York Mercantile Exchange).
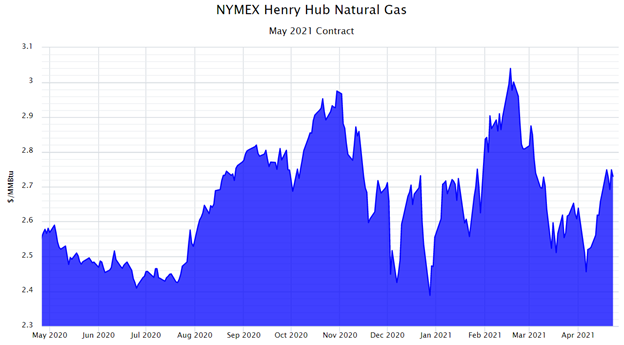
Figure 1: NYMEX Henry Hub Natural Gas May 2021 from 5
The balance of this article examines other commodities, comparing prompt month contract prices for those commodities with natural gas.
Copper:
Over the last year, the May 2021 contract price for copper has more than doubled, as shown in Figure 2. Copper trades in US dollars per pound and over the past 12 months, the May 2021 contract price has increased from approximately $2.30/pound in late April 2020 to $4.42/pound, which is its 12-month high.
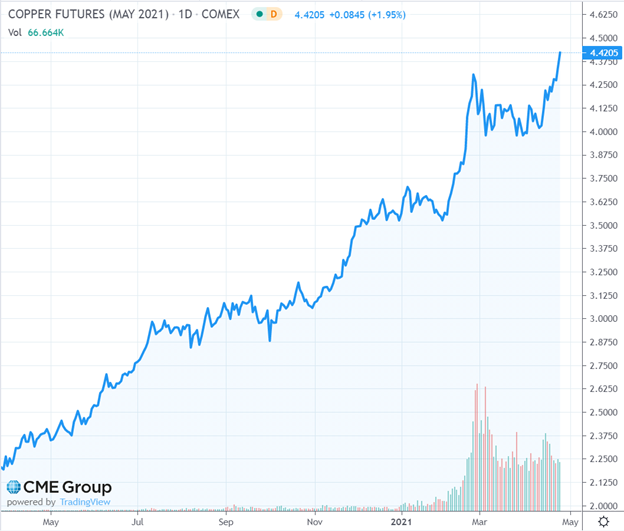
Figure 2: Copper Futures (May 2021) from cmegroup.com
Aluminum:
Like copper, the May 2021 contract price for aluminum has steadily increased over the last year as shown in Figure 3. Aluminum trades in US dollars per metric ton (≈2205 lbs.) and was trading at approximately $1,600/metric ton last April. Today, aluminum is trading at just under $2,400/metric ton, which is 50% higher than it was 12 months ago.
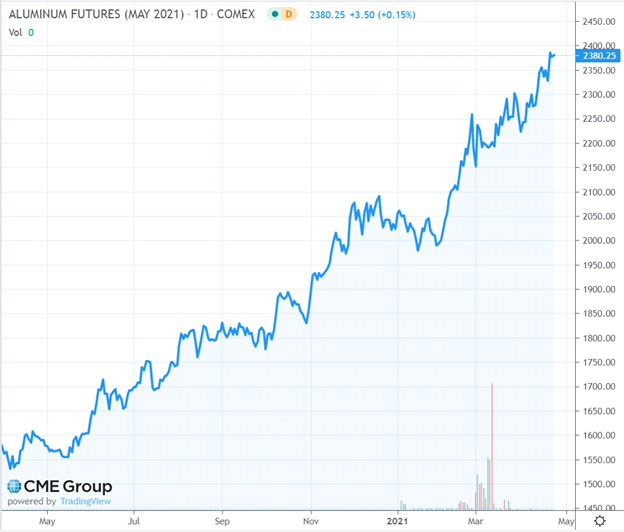
Figure 3: Aluminum Futures (May 2021) from cmegroup.com
Steel:
The May 2021 contract price of steel was flat until October 2020, which is when it began a significant rally, as shown in Figure 4. Hot-rolled coil steel trades in US dollars per short ton (2,000 lbs). Its May 2021 contract was trading around $500 this time last year and below $600 per short ton as late as October. Today, steel is trading just over $1,500 per short ton for its prompt month contract, which is a three-fold increase in 12 months.
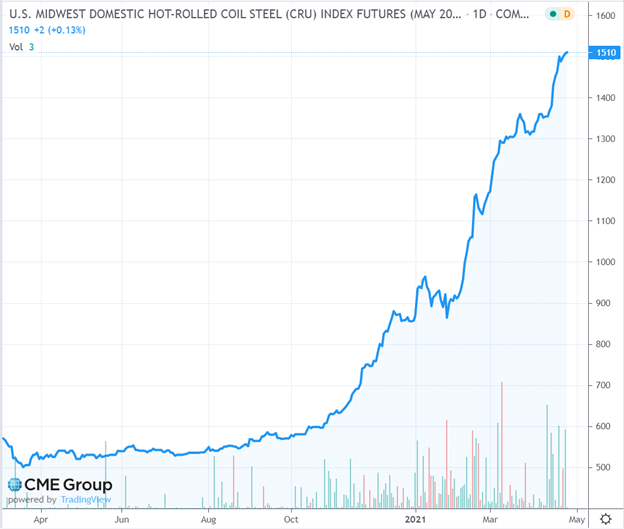
Figure 4: US Midwest Domestic Hot-Rolled Coil Steel Futures from cmegroup.com
Lumber:
The prompt month contract price for lumber has increased by a factor of four over the last year. The May 2021 contract price of lumber, the average DIYer’s weekend commodity of choice, trades in US dollars per 1,000 board feet and is shown in Figure 5. Like copper, aluminum, and steel, the price of this commodity has been on a steep upward climb over the last several months, which you may have noticed if you have been to your local lumber yard or home improvement store recently. The May 2021 contract price was trading at approximately $320 per 1,000 board feet last year and is now over $1,400 and continues to rise.
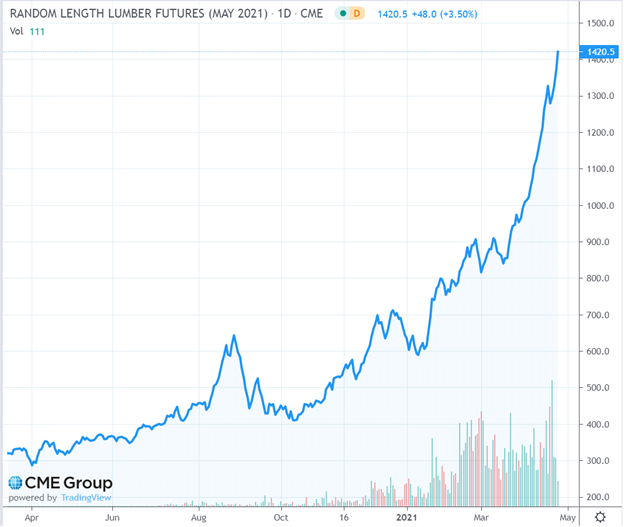
Figure 5: Random Length Lumber Futures (May 2021) from cmegroup.com
Crude Oil:
In terms of energy-related commodities, the May 2021 contract price for crude oil has followed the pattern of many other commodities identified above and has rallied over the last year as shown in Figure 6. Crude oil trades in US dollars per barrel, which seems to have hit some headwind lately compared to these other commodities. Its rally from around $32/barrel last April to approximately $62/barrel today has been a great recovery, but unlike the metals and lumber, crude oil hit a resistance level of about $66/barrel in early March and has been range-bound between $58 and $64 for most of the last two months. Despite this most recent resistance, crude oil’s prompt month contract has nearly doubled over the last 12 months.
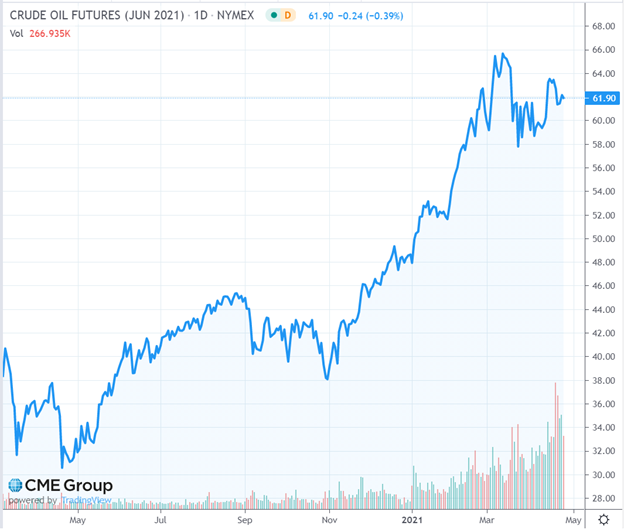
Figure 6: Crude Oil Futures (June 2021) from cmegroup.com
Most of the commodities referenced above experienced both decreases in supply and increases in demand due to the pandemic, pushing prices up. Natural gas and crude oil prices, on the other hand, were constrained by demand destruction last spring and summer. Figure 7 shows that the demand for gasoline has just started to approach pre-pandemic levels. Additionally, the global demand for LNG has required domestic LNG terminals to operate at record high levels. Higher gas exports coupled with storage levels that are below the 5-year average could mean that an increase in production rates will be necessary to hold off a rally in natural gas futures. As the examples above show, when demand jumps and supplies are tight, the price response is often not linear. Given that natural gas futures have remained relatively stable, prudent risk management suggests some form of hedging that limits exposure to volatile and potentially exponential increases in commodity prices.
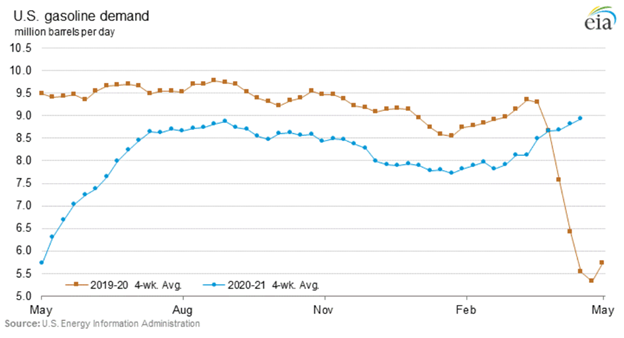
Figure 7: US Gasoline Demand from eia.gov


