
Last month, we reported that while short-term crude prices were near 20-year lows, natural gas futures prices for the year 2021 were reaching 24-month highs. The rally in natural gas prices in 2021 was primarily driven by the fear that a slowdown in crude oil production from reserves, such as the Permian Basin, would produce less natural gas, which is a by-product of the crude oil extraction process.
This past month, we have seen a decent reversal in the prices of both commodities. Figure 1 shows how crude oil futures for July delivery have traded over the last several months. Crude oil futures prices for July (now the prompt month) are trading around $34 per barrel. While this is significantly less than where it was trading in late February (between $48 and $52 per barrel), the price of crude has nearly doubled from its low of $17 to $18 per barrel in late April.
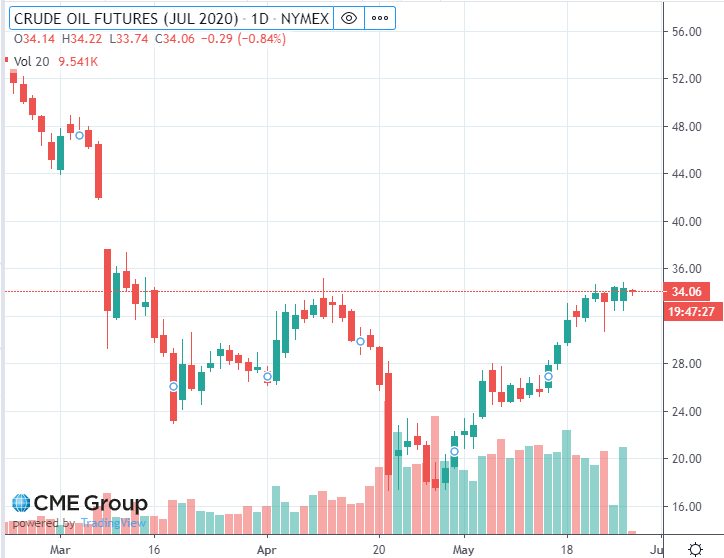 Figure 1: Crude Oil Futures (Jul 2020), by CME Group
The rally in crude oil prices over the past month has reduced the probability of a massive reduction/shutdown in crude oil production from the largest oil reserves in the United States and also lessened the risk that supplies of low cost natural gas will be cut back. However, the reduced risk of a crude oil production slowdown has not had a material impact on short-term natural gas prices.
Lately, natural gas prices have struggled to sustain any rally as prices approach and increase beyond $2.00 per Dth. Futures prices for calendar year 2021 are reacting quite differently as shown in Figure 2. This chart shows that prices for calendar year 2021 (blue line) have come down from the 24-month high set on May 5th of $2.77 per Dth, and are now trading 10¢ lower at $2.67 per Dth. This has produced a steep backwardation (prices get less expensive into the future) in gas prices into 2022 and 2023 of 20¢ and 9¢ per Dth, respectively.
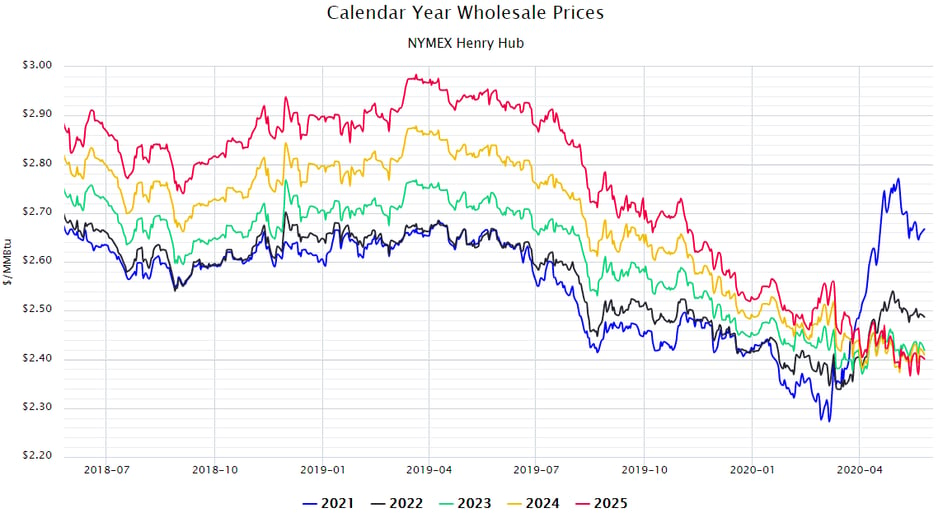 Figure 2: Calendar Year Wholesale Prices NYMEX Henry Hub, by 5
The U.S. Energy Information Association (EIA) is predicting that natural gas storage levels will be close to their capacity by the end of the year. Figure 3 shows the current storage levels (red line), the forecasted storages levels (dashed red line) and the five-year historical range (grey line). This data from the EIA predicts that the amount of natural gas in storage will exceed its 5-year range by late October or the beginning of November. Based on the EIA’s most recent Short Term Energy Outlook (STEO), is it possible that natural gas prices for 2021 could come under significant downward pressure over the next few months. If that happens, it is also likely that the outer years (2023 – 2035) could also see their trends reversed, and start to move up as sustained low natural gas prices could continue to remove incentives for natural gas producers to spend any capital investments in future production. If this happens, it is possible to see a reversal of the highs we are experiencing in 2021 and in the lows we are seeing in 2025.
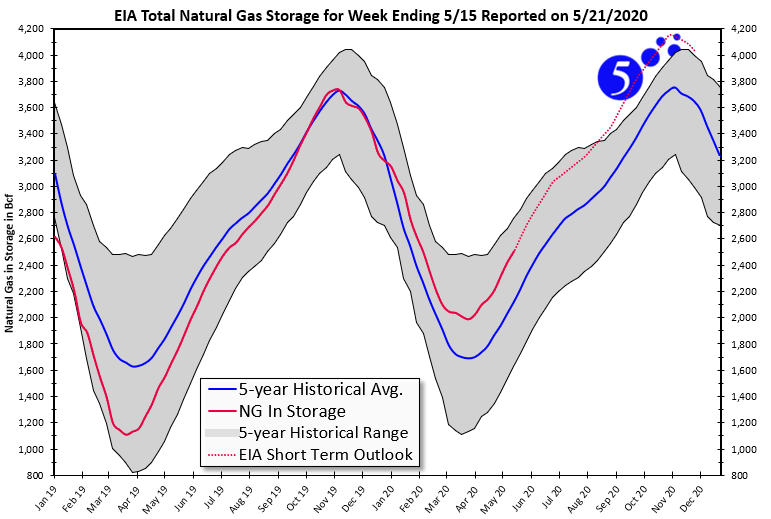 Figure 3: EIA Total Natural Gas Storage for Week Ending 5/15, by 5


