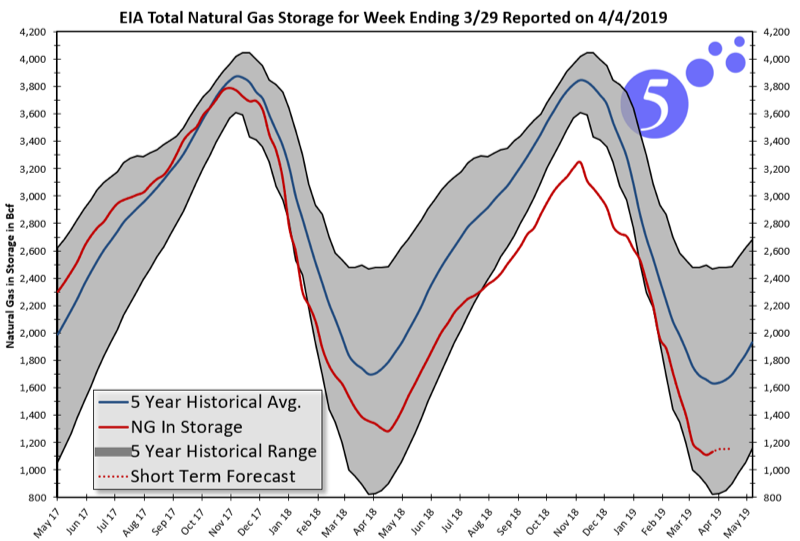
April 1st marked the end of natural gas withdrawal season and the beginning of injection season. The winter of 2018/19 is officially in the past and gas storage levels are at their lowest levels since the spring that followed the very cold winter of 2014.
With the amount of natural gas in storage at historical lows, natural gas prices have been pushed up for the balance of 2019. The figure below shows NYMEX gas prices for the period of May 2019 to December 2019. Note that between December 2018 and March 2019, the May to December strip has continued to set higher highs and higher lows
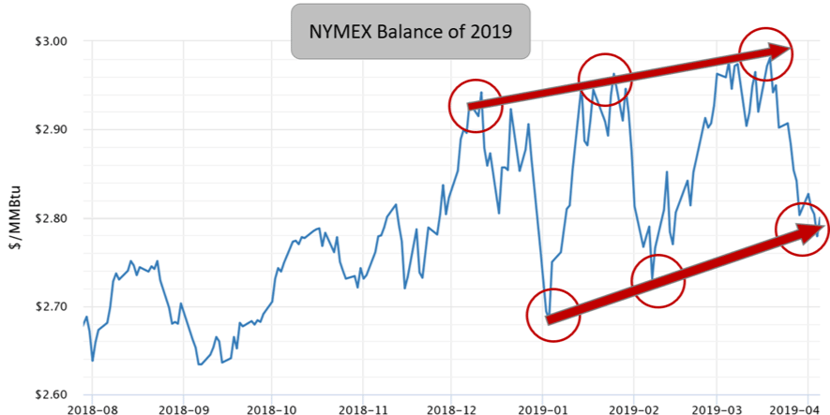 NYMEX Gas Prices from May 2019 to December 2019 by 5
When we look beyond 2019 and into 2020, a similar pattern is observed. Since the beginning of this year, we’ve seen natural gas for calendar year 2020 trade in an upward-trending range, again creating higher highs and higher lows. The price for natural gas in 2020 is now trading just below the 12-month high set a couple weeks ago as well the high that was set last spring.
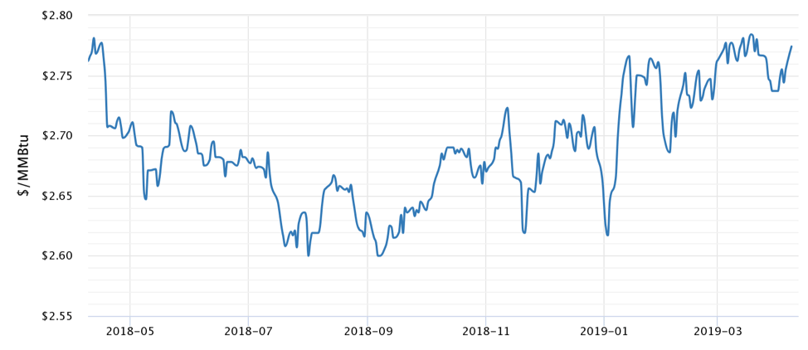 NYMEX Gas Prices for Calendar Year 2020 by 5
It appears the market is starting to realize that the dramatic growth in gas production over the past 18 months has been completely offset by an increase in demand, through both increased domestic consumption and exports. This seems to have taken a lot of the bearish sentiment out of the market and is starting to drive the next few calendar years (2020 – 2023) back to a range closer to recent index settles.
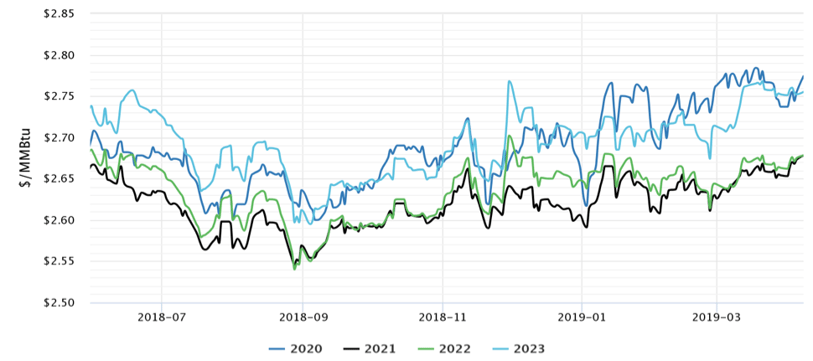 NYMEX Gas Prices for Calendar Years 2020 to 2023 by 5


