
Since early 2018, the forward power market in Texas has been in various states of backwardation (prices for a commodity get less expensive into the future). This backwardation made longer retail electricity agreements attractive as each additional year purchased was a chance to capitalize on lower futures prices and reduce the overall weighted average price. Last fall, the slope of that backwardation reached its maximum negative slope (see Figure 1). On November 1, 2019, the price for calendar year 2021 was trading at approximately $44/MWh, while 2028 was trading below $24/MWh. The $20/MWh discount from 2021 to 2028 produced a significant amount of backwardation and a downward sloping forward market for wholesale electricity.
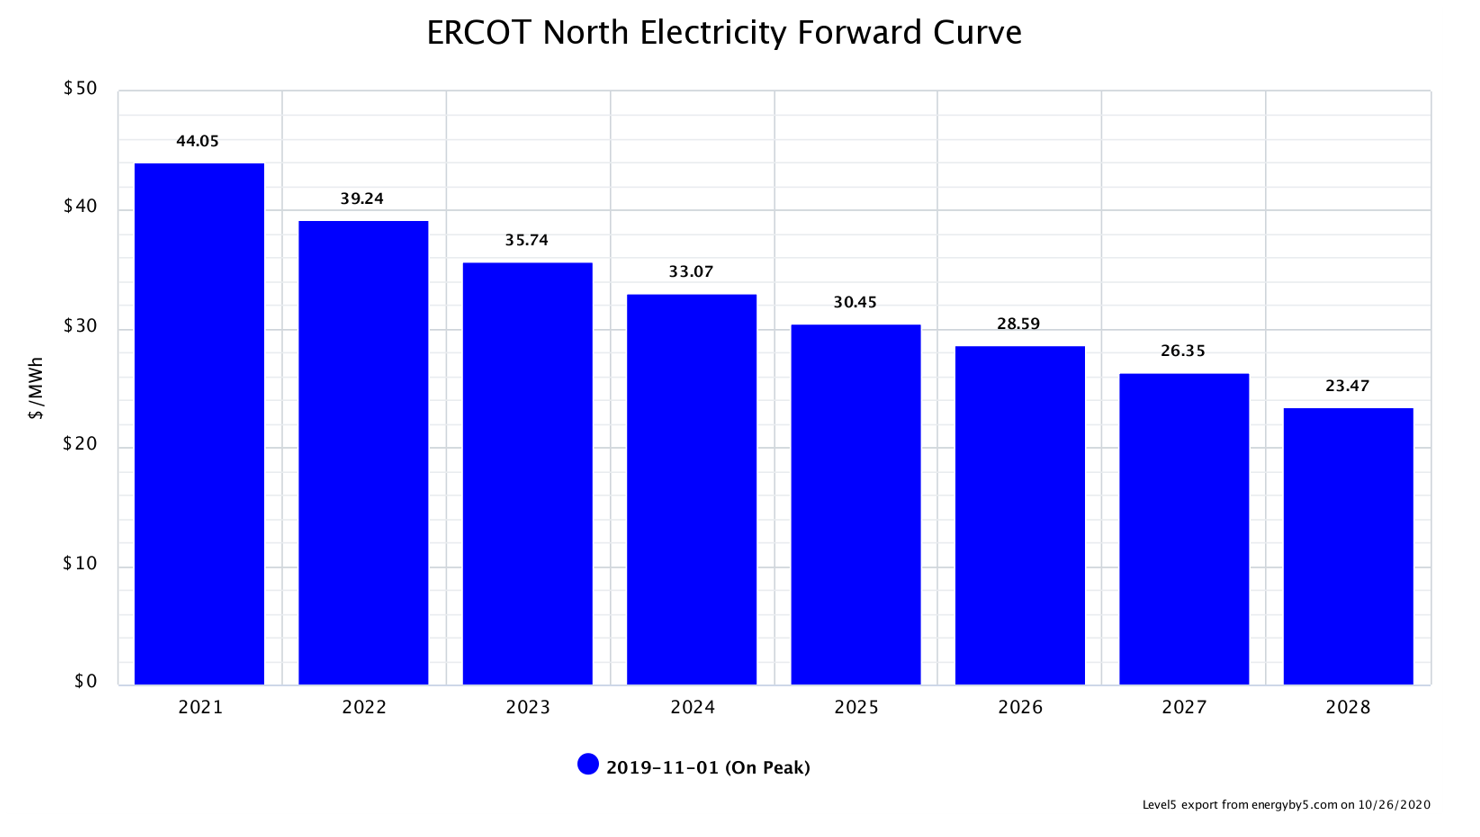
Figure 1: ERCOT North Electricity Forward Curve from 5
This market phenomenon was mostly driven by the significant backwardation of summer on-peak prices (the spikes in Figure 2). And even though there was a minor drop year-over-year in the winter values (the smaller humps in Figure 2), the dramatic decrease in summer on-peak power prices that was a primary driver of lower futures prices. This produced record low retail electricity prices in ERCOT, where summer usage and prices dictate market movements.
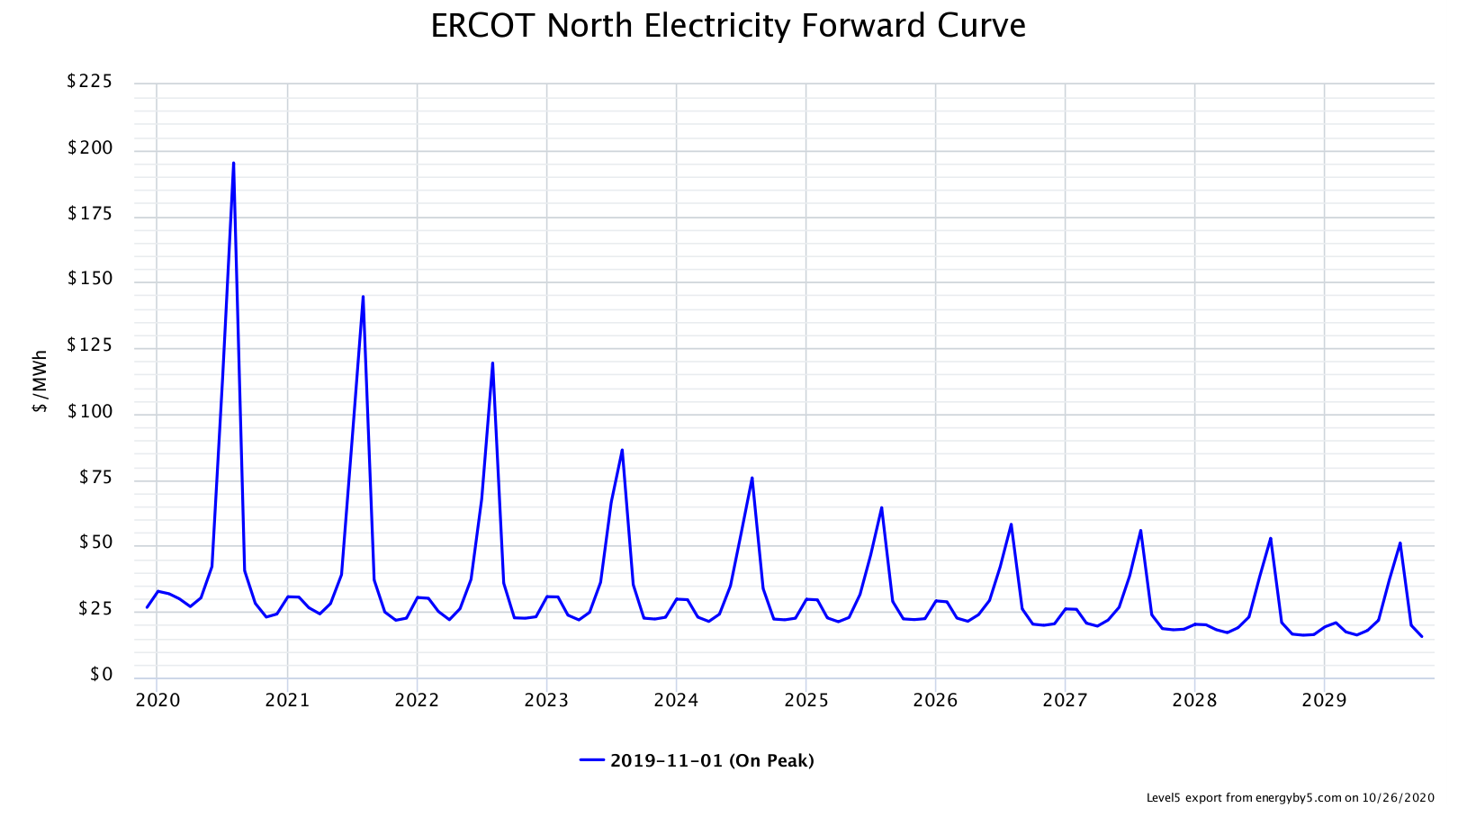
Figure 2: ERCOT North Electricity Forward Curve from 5
Over the last year there has been a reversal of trends, with the outer years (2024 – 2029) beginning to rise, while the closer years (2021 – 2023) staying range bound within a $4/MWh trading range as shown in Figure 3.
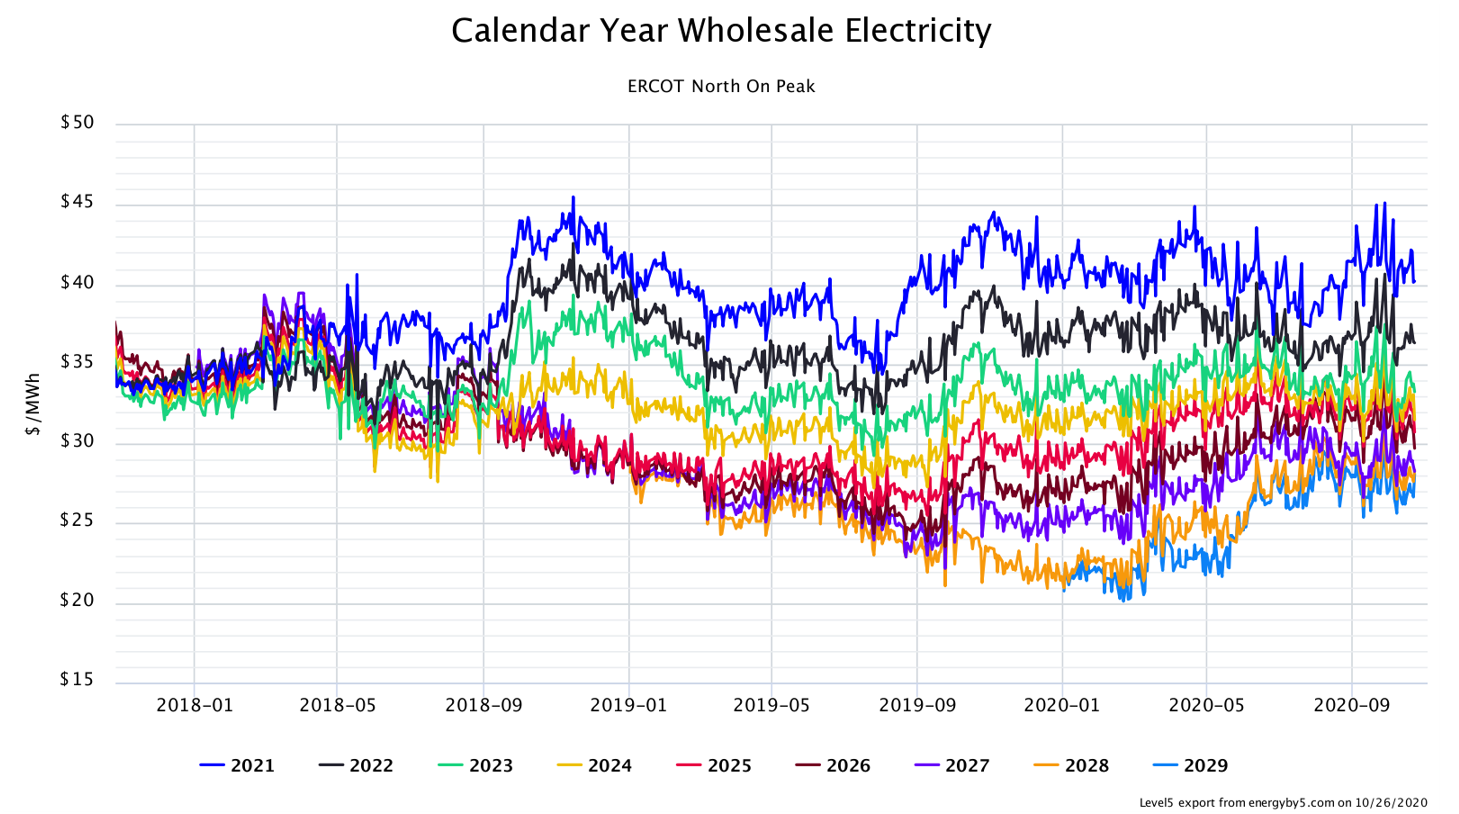
Figure 3: Calendar Year Wholesale Electricity ERCOT North from 5
What has been surprising is that it isn’t the rally of the summer on-peak months that is bringing up the outer years. The rally in the outer years seems to be driven by price increases in the non-summer months and off-peak periods. Prices for the non-summer months (October – April) beyond 2023 have rallied significantly compared to this time last year. This is shown in Figure 4 where the blue line is the forward curve from last November and the black line is the current forward curve. This chart shows that while summer on-peak prices have continued to fall, prices in the non-summer months have rallied.
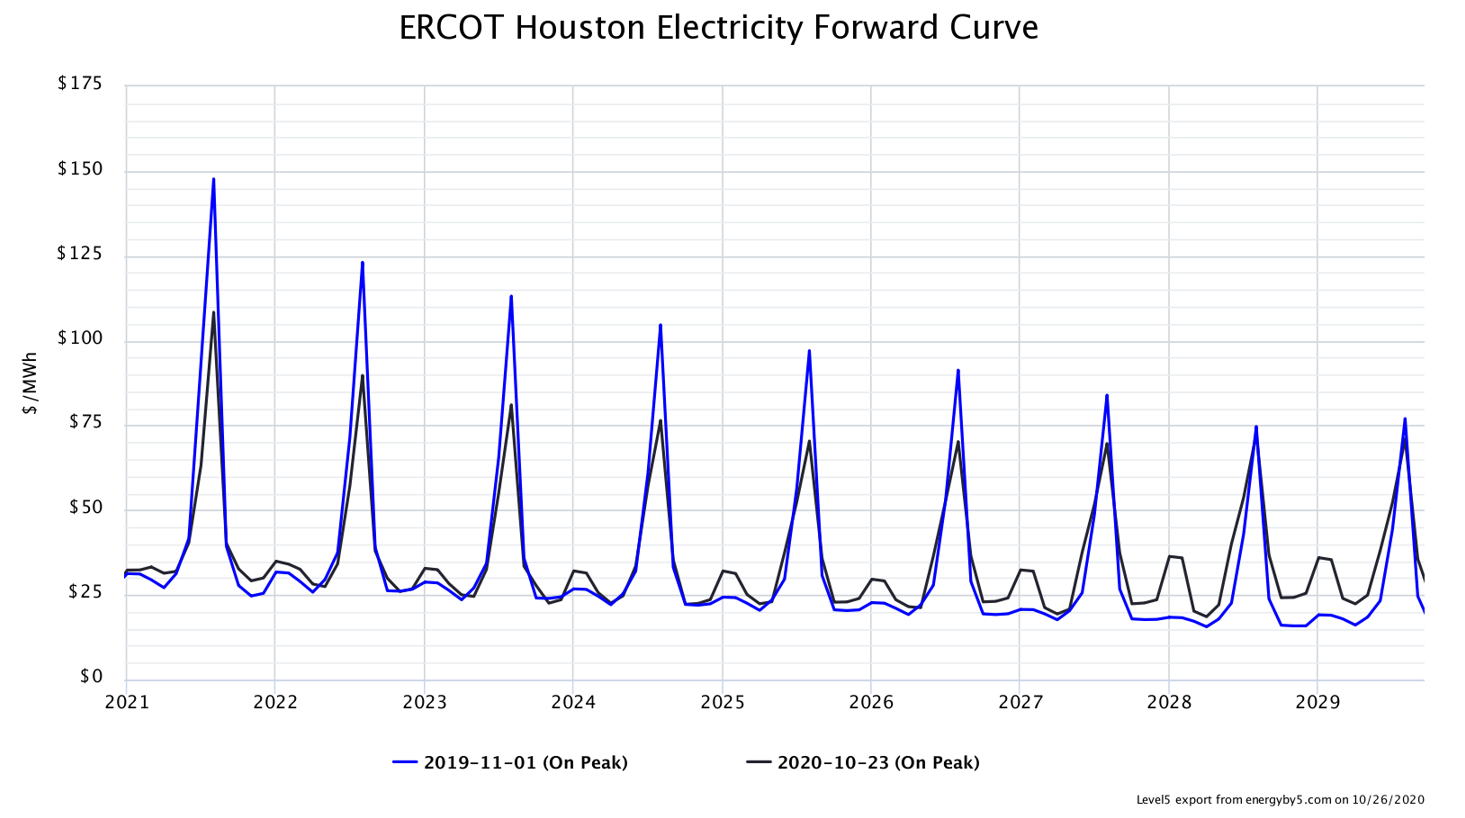
Figure 4: ERCOT Houston Electricity Forward Curve from 5
The rise in the non-summer months, along with the rally in off-peak prices (all night and weekend hours) has caused prices in the outer calendar years to increase by over $7/MWh as shown in Figure 5. This can be attributed to multiple drivers summarized below.
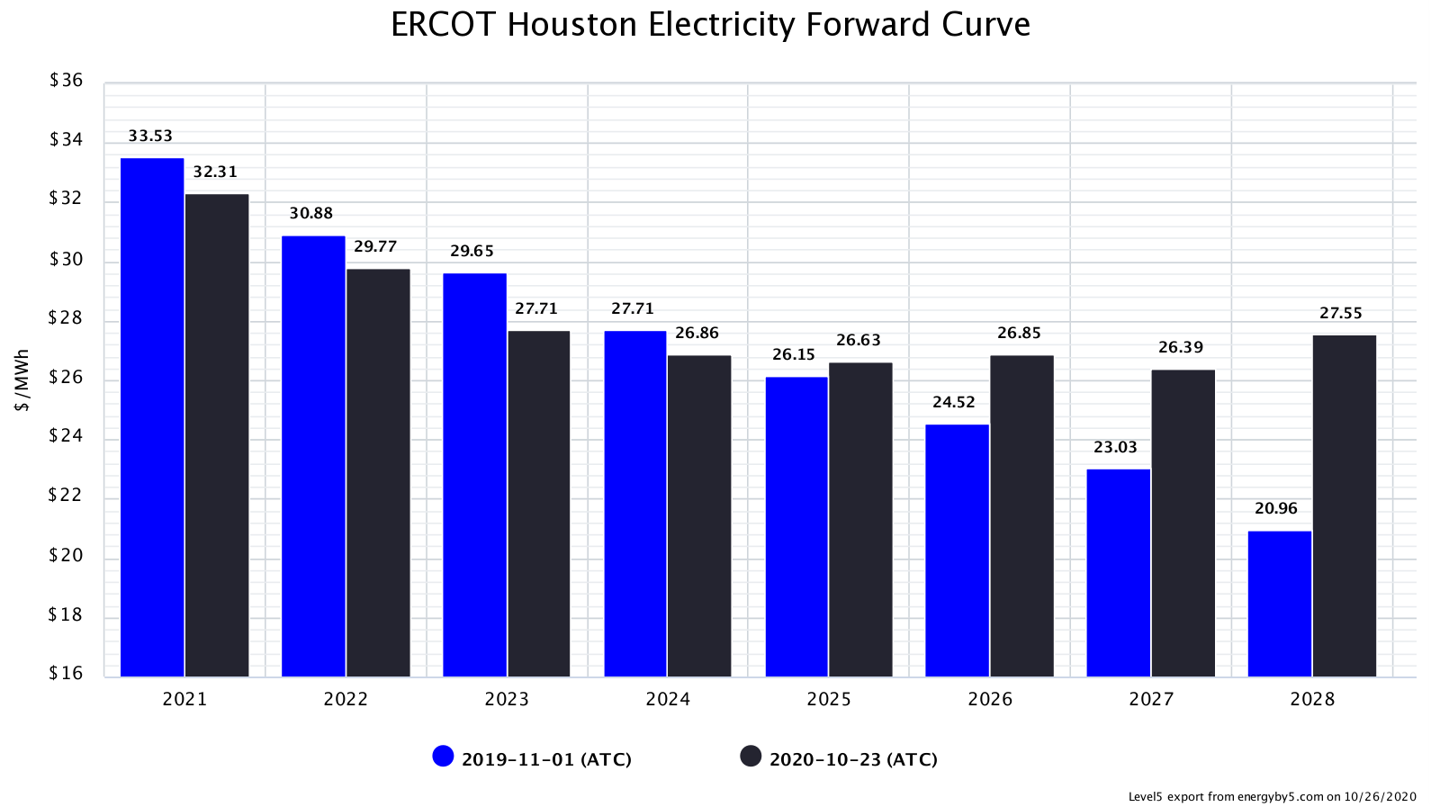
Figure 5: ERCOT Houston Electricity Forward Curve from 5
- Increased reliance on renewable generation - As the state’s generation fleet is made up more and more from renewable generation, it becomes increasingly difficult to rely on that generation to economically dispatch when it is needed the most, as evidenced by California’s rolling blackouts this summer. This can also be seen on cold North Texas mornings, when electricity demand ramps quickly in the early morning hours, before the sun rises, when the wind is calm, and both solar and wind generating assets can’t keep up with rising demand.
- Load peak shifts to the weekends - Electricity demands on the weekends are quickly approaching the peaks set on summer weekdays as residential load continues to increase, while commercial and industrial electricity demand slowly becomes a seven day per week necessity. As this trend continues, the summer off-peak hours and non-summer months will continue to have upward pressure applied by traders.
An example of both drivers can be seen in the settled real-time prices from Monday, October, 26th. On this day, the average real-time price of $165/MWh was the highest average price of the year, eclipsing even the record-breaking demand day in July. High real-time prices were not due to excessive demand. The peak demand on Monday was only around 46,000 MWs, or about 65% of a typical warm summer afternoon, low even for a mild day in October. Instead, it was a miss in the forecast for the amount of wind generation expected from the grid.
On Sunday, October 25th, ERCOT was forecasting over 19,000 MW of wind generation on Monday from 1:00 AM through 11:00 PM. However, by early afternoon the actual amount of wind generation was less 9,000 MWs. By 8:00 PM, the total wind powered generation was below 6,000 MW, a miss of almost 13,000 MWs, almost two times the annual average hourly output of all of the state’s coal plants combined.
This increase in off-peak and non-summer price volatility is what is driving up forward market prices. Increased reliance on generation resources that are not as reliable as those they are replacing will likely continue to increase forward market prices. This upward pressure on forward prices will likely continue until the market is confident that there is enough future generating capacity to keep up with demand.


