The price for this winter’s natural gas has seen its fair share of volatility over the past 12 months. Coming out of last winter’s abnormally warm weather, prices for the 2021 calendar year strip saw its all-time low of $2.27 per MMBtu on Friday, March 6, 2020. This was the last trading session before the Saudi Arabia and Russia feud over cutting crude supplies at the beginning of the coronavirus pandemic. Since last March, natural gas prices saw two sustained bull markets where prices rallied more than 50¢, from April through May, and then again from late July through the end of October. These two rallies are highlighted in Figure 1.
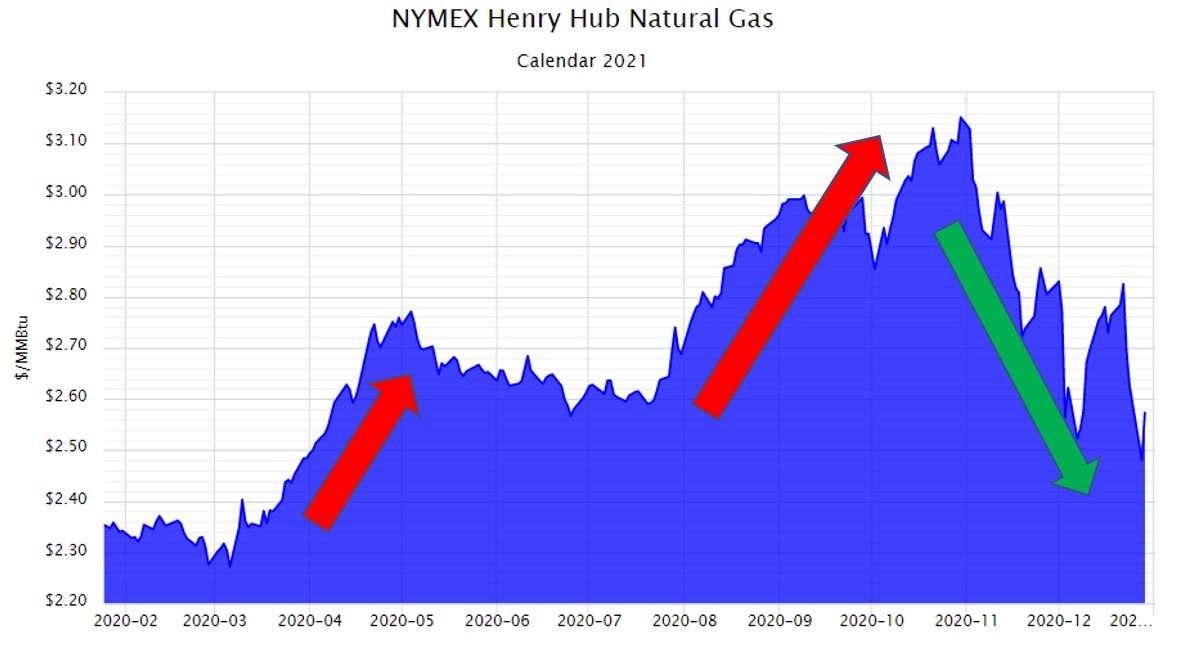
Figure 1: NYMEX Henry Hub Natural Gas Calendar 2021 from 5
In the beginning of November, which was warmer than normal, traders began to lose their fear of a colder-than-average winter. This prompted a significant price correction as gas prices for calendar year 2021 collapsed. Bears began to take over the market as most of the country, except parts of the West Coast, saw above average temperatures throughout the month of November. These warmer temperatures can be seen in Figure 2 which shows November’s deviation from average temperatures across the country.
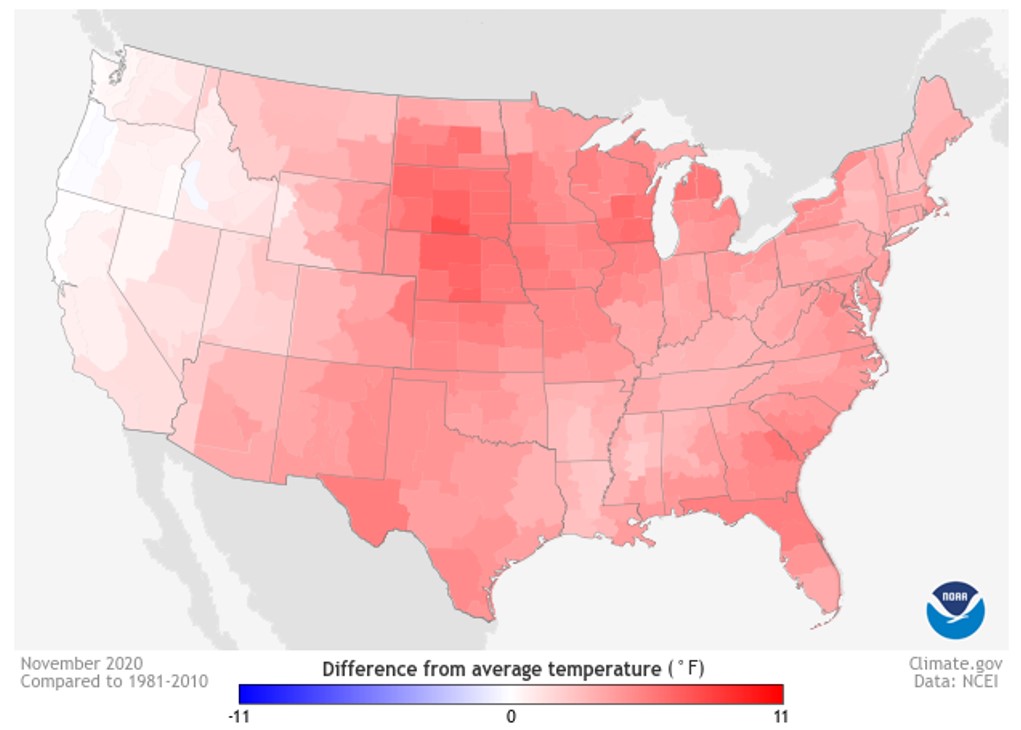
Figure 2: November 2020 Difference from Average Temperature from noaa.gov
Temperatures in large portions of the Midwest and Northeast were also higher than average as shown in Figure 3. This reduced demand for natural gas used for heating put additional downward pressure on near-term prices. As December’s actual temperatures started to replace forecasts, it became obvious that a cold start to the winter of 2020/21 was not likely.
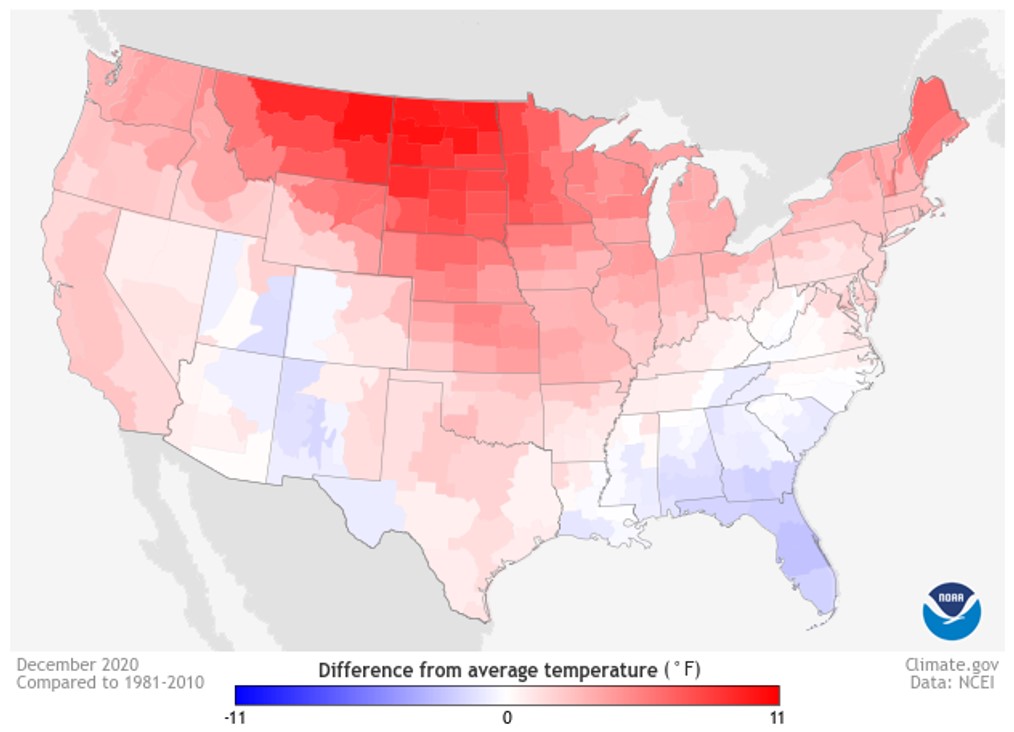
Figure 3: December 2020 Difference from Average Temperature from noaa.gov
Even though there are still a couple of days left in this month, Figure 4 shows that temperatures for January 2021 are, on average, between 5 to 9 degrees F above normal.
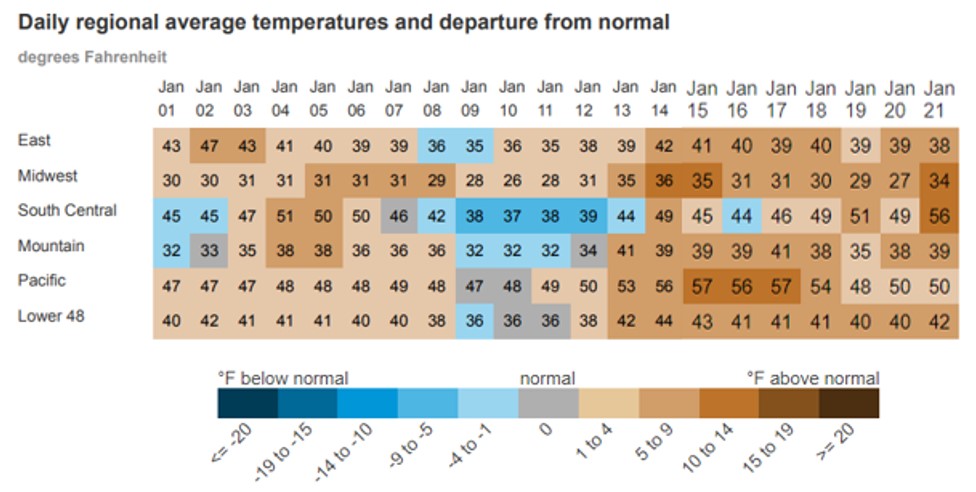
Figure 4: Daily Regional Average Temperatures and Departure From Normal from eia.gov
To put these temperatures into perspective, for the week of January 8th through the 15th (the coldest week so far in January) the EIA reported that 187 billion cubic feet (Bcf) of natural gas was withdrawn from storage. This was the largest withdrawal for this winter. Next week, between 135 and 140 Bcf are expected to be withdrawn. In comparison, the largest withdrawals from the last four winters ranged from a low in January of 2020 of 201 Bcf to a high of 359 Bcf during a week in January 2018. And keep in mind, that last January, the country was producing more natural gas, and exporting less, and still managed a stronger withdrawal from storage.
Last week, the Climate Prediction Center, a department of the National Weather Service, updated their forecast for the balance of the winter. This forecast looked at temperatures for the month of February in addition to the three-month period from February through April. These forecasts, shown in Figures 5 and 6, indicate a higher probability of above-normal temperatures through April for most of the country.
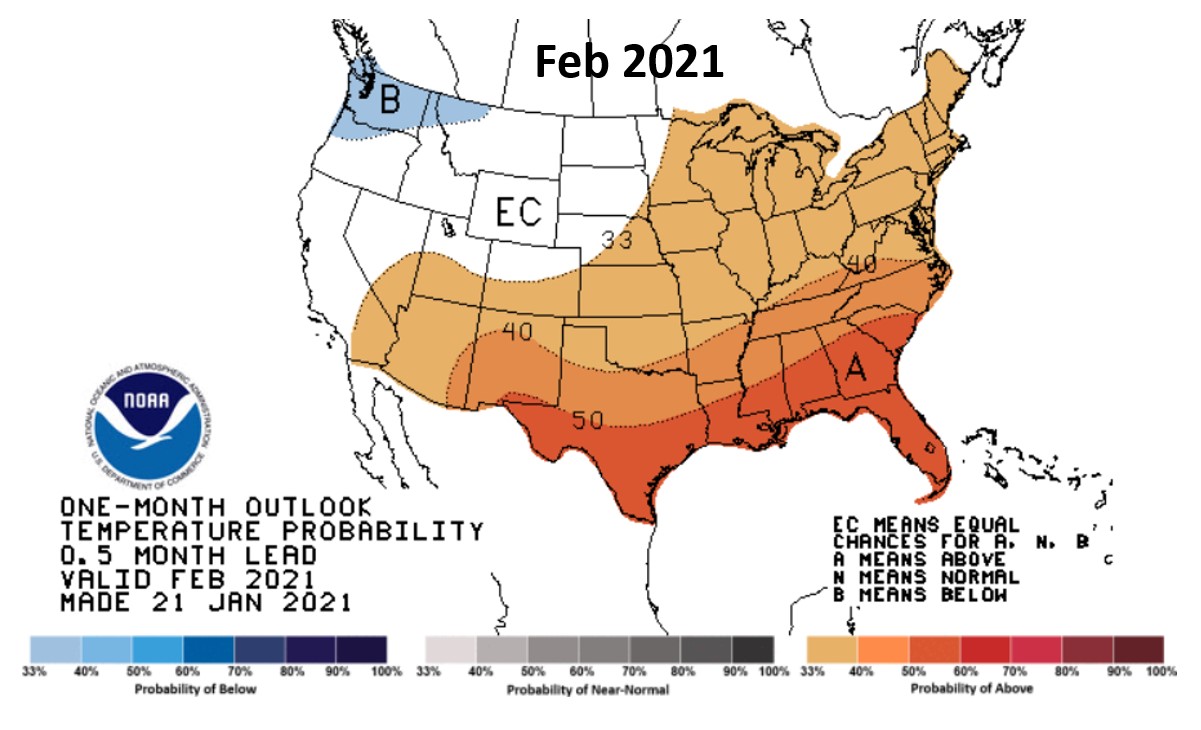
Figure 5: February 2021 Temperature Forecast from noaa.gov
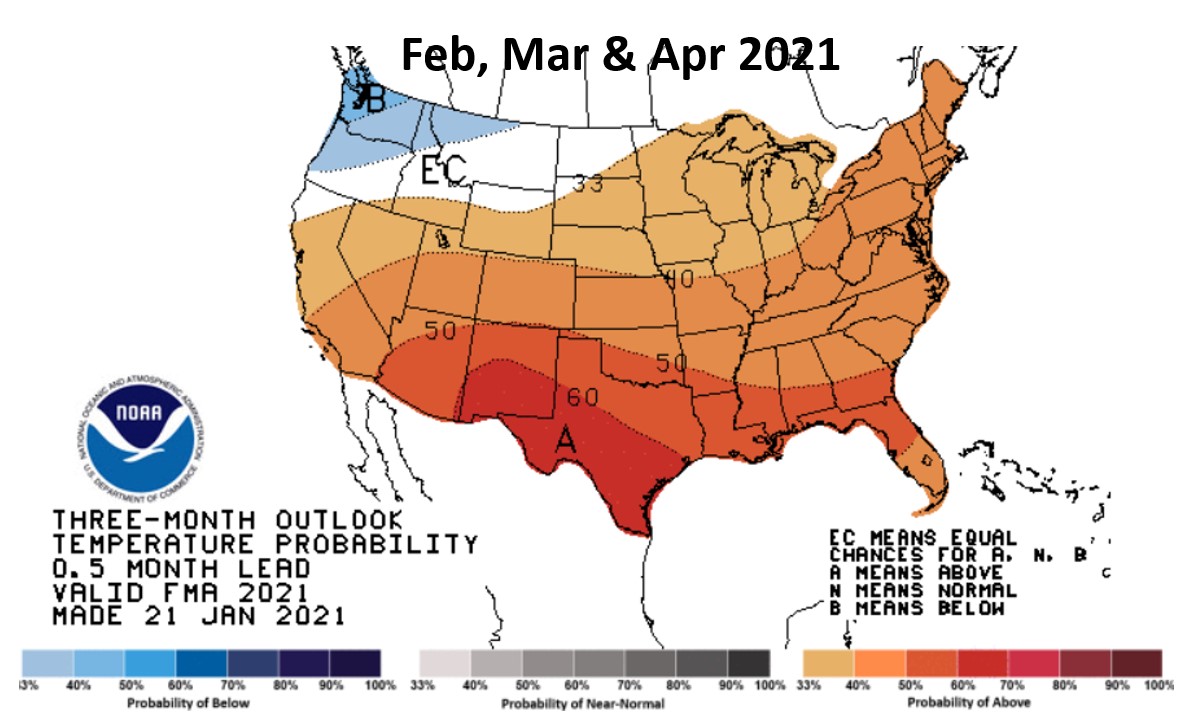
Figure 6: February, March & April 2021 Temperature Forecast from noaa.gov
Figure 7 shows how natural gas prices for the month of February 2021 have traded going back to last year. The downward movement in natural gas prices since November 2020 has already taken all of this bearish weather news into account, and at the end of last week, February’s forward contract was trading near lows that were set last March and again in early and late December, of approximately $2.40 per MMBtu. These current prices are showing a strong level of support (floor) at $2.40 given that the market has tried three times over the last several weeks to break below this threshold.
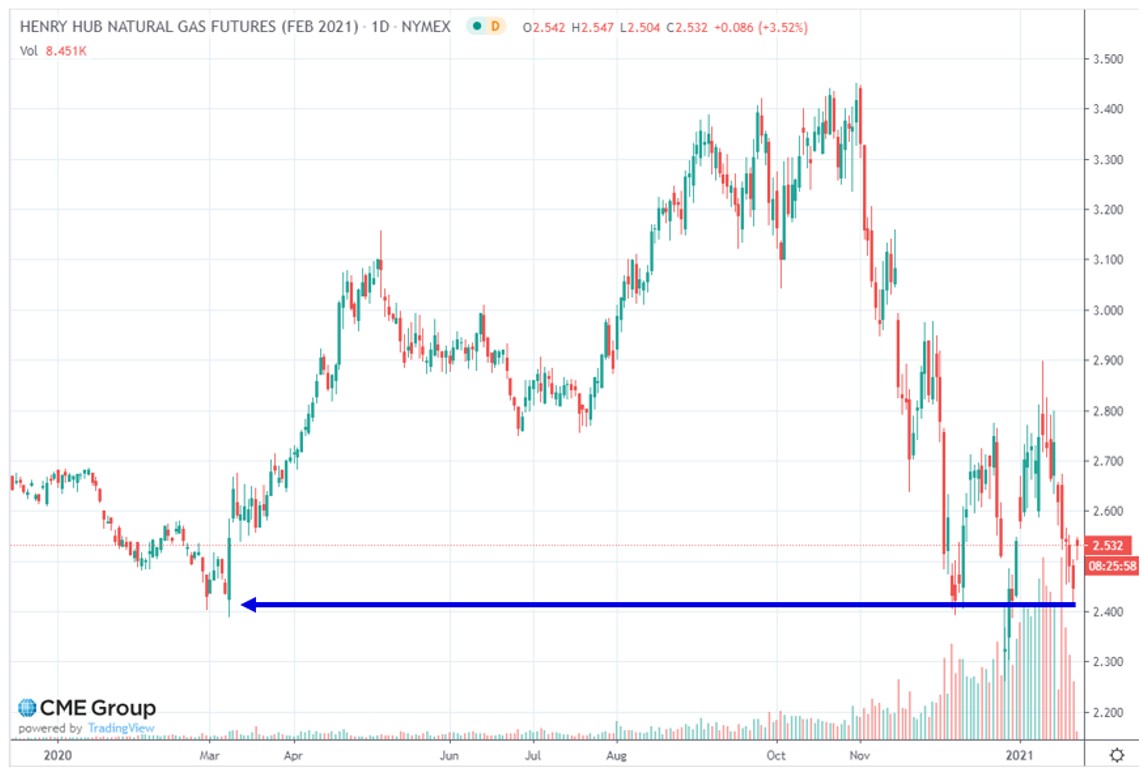
Figure 7: Henry Hub Natural Gas Futures (Feb 2021) from cmegroup.com
It is important for clients to understand the affect these very low spot prices are having on the natural gas forward curve. Near-term prices, driven by warmer winter weather, have put downward pressure on gas prices in the first few months of 2021 and 2022 while simple economic pressures are pushing up forward prices beyond 2023. High futures prices beyond 2023 are driven by market fears that sustained low prices will remove incentives to invest capital in new natural gas exploration and production. While the balance of 2021 and the winter of 2022 have fallen significantly in the last two weeks, calendar years 2023 and beyond continue to climb, pulling further and further away from their lows set last summer. Clients with open positions in natural gas and electricity in 2021 and 2022 should capitalize on these near-term bearish forces and consider making purchases for their businesses.


