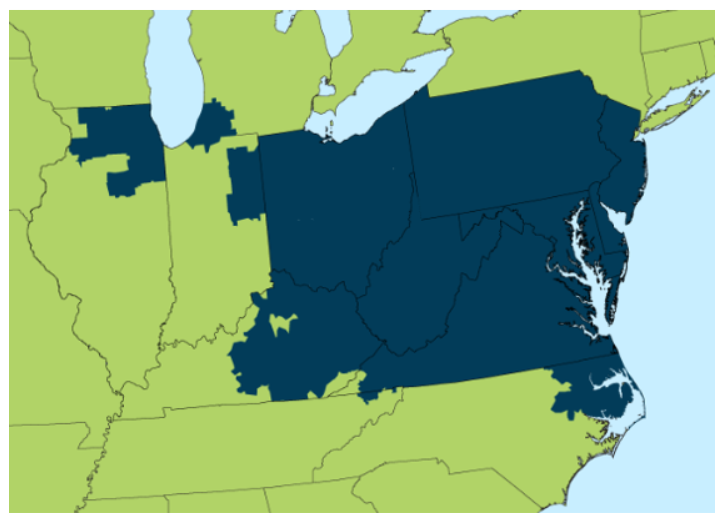
Before each winter, many organizations responsible for overseeing North America's power grids release risk assessments. These reports primarily focus on reliability and resiliency, with less emphasis on wholesale prices. Although wholesale prices can indicate risk, forward prices do not always fully capture the potential risk of energy scarcity. Conversely, forward price volatility may sometimes reflect risks that are less likely than the prices suggest. This article summarizes some of these risk assessments and highlights the risks currently indicated by forward market prices for January and February 2025.
To start, the North American Electric Reliability Corporation (NERC) releases a Winter Reliability Assessment (WRA) each fall, covering key markets and regions across North America, including PJM, New York, New England, and Texas. This year’s report largely aligns with expectations, indicating that most deregulated regions face reliability risks during periods of "above-normal" load conditions. This risk summary is shown below in Figure 1.
Figure 1. Winter Reliability Risk Area Summary, by NERC
According to NERC, the primary risk facing most regions this winter is the availability of natural gas. While the power industry has made significant strides since 2021 to enhance power plant performance, much of this progress has focused on improvements in planning and forecasting. However, the most significant challenge remains the capacity of natural gas pipelines and maintaining adequate pipeline pressure levels during periods of extreme cold, which continue to pose the greatest threat to reliable power production during the winter months.


