Throughout the year, analysts wrestled with many variables as they tried to forecast the End of Season (EOS) natural gas storage levels, which were reported by the U.S. Energy Information Administration (EIA) in the first week of November. The amount of gas in storage was impacted by the following:
- Lower demand for gas as the economy slowed
- Large drops in natural gas production from the decline in demand for crude oil
- Weaker international demand for Liquified Natural Gas (LNG)
- The hurricanes that have consistently battered the gas producing region along the Gulf Coast and the associated major LNG export terminals
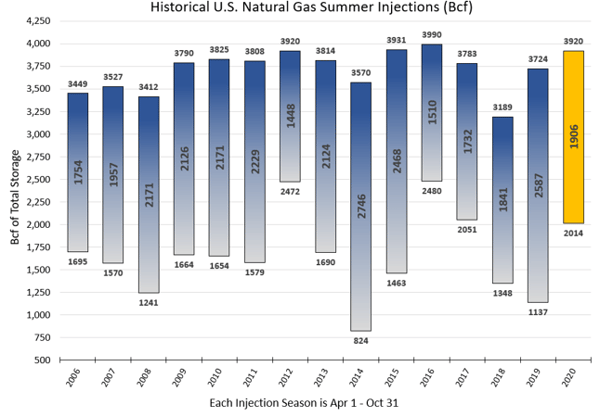
Total storage inventory levels on November 1st were 3,920 Bcf. This is less than the optimistic forecasts this summer when analysts were predicting levels in excess of 4,000 Bcf. Overall those forecasts were not far off, especially given the multitude of factors identified above.
 Figure 1: Historical US Natural Gas Summer Injections from 5
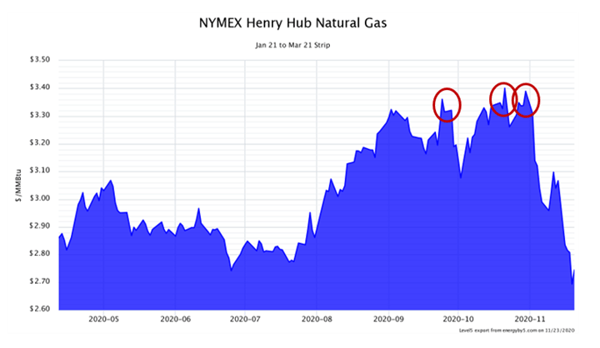
The gold bar in Figure 1 shows this injection season’s total build of 1,906 Bcf and how it compares to injections over the last 14 years. Normally, an inventory level above 3,900 Bcf at the beginning of winter would put downward pressure on natural gas prices. However, the 3,920 Bcf in storage fell short of expectations that were set this summer. This, coupled with the continued weakness in weekly natural gas production rates have caused forward prices for Q1 of 2021 to rally, reaching strong resistance levels of $3.40/MMBtu three times during the month of October (See Figure 2).
 Figure 2: NYMEX Henry Hub Natural Gas Jan 21 to Mar 21 from 5
Often gas is withdrawn from storage in November as colder weather sets in. And while it is common to observe a net build in inventories for one week, it is rare to see builds for each week in the month of November. The warm weather this month means that less gas is being taken out of storage and continued warm weather in the short-term forecast suggests additional builds are possible between now and the end of the month.
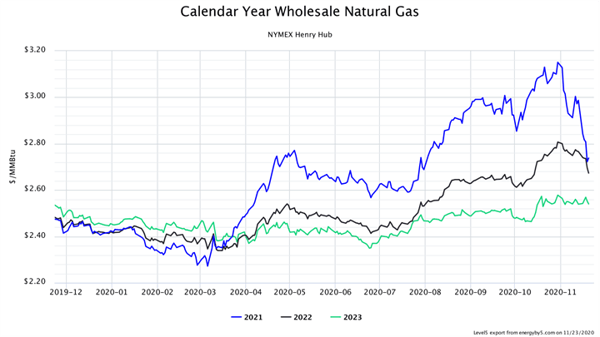
For the first two weeks in November there has been a net build of 39 Bcf, with an estimated additional 10 Bcf over the next two weeks, compared to last November which had a net withdrawal of 138 Bcf. Natural gas prices for this winter have plummeted with the news of this late season build and the warm forecast for December. Since the market highs on the last trading day of October, the winter strip has sold off almost 70¢ per MMBtu, which erased a bull market run of just over 3 months in the course of a few days. The impact was not just limited to Q1 of 2021, the entire 2021 calendar strip has fallen from $3.15 to $2.74, while calendar year 2022 has dropped about 13¢, from $2.80 to $2.67. These price movements are shown in Figure 3.
 Figure 3: Calendar Year Wholesale Natural Gas from 5
While warm weather remains in the forecast this week, it appears as though this market might be a little over sold and could be setting a floor rather quickly. With production numbers remaining low and natural gas demand both domestically and internationally remaining strong, it is hard to explain such a strong sell-off in prices due to a warmer than normal November. If this market is to sustain these lower prices through the winter, we will likely need to see a repeat of last winter’s record warmth. And in the week of Thanksgiving, it is too early to claim that winter is over.


